
Learning Mathematics
A straight-line graph is not always a proportional relationship
A proportional relationship has a constant ratio and a graph through the origin. Compare two simple pricing examples to see why a straight line is not enough.

Learning ideas for students, families and educators.
A proportional relationship has a constant ratio and a graph through the origin. Compare two simple pricing examples to see why a straight line is not enough.

Use paper shapes to distinguish turning symmetry from mirror symmetry and explain why one test does not replace the other.

Compare circular lids to see why circumference divided by diameter approaches the same number. A practical activity separates pi from measurement error.
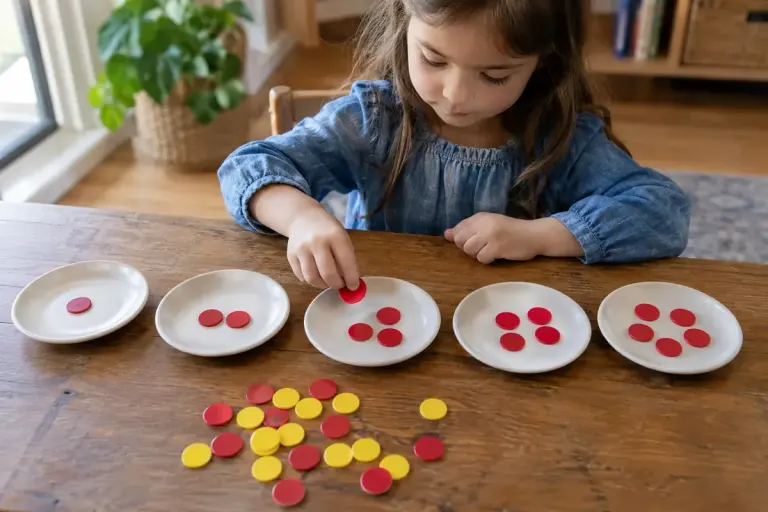
Use multiplication and equal groups to explain why zero divided by five is zero, while division by zero has no defined answer in ordinary arithmetic.

Use equal paper strips to explain addition with matching denominators, showing that the number of pieces changes while the size of each piece stays the same.

Connect subtraction to the distance between numbers, then use a number line to explain why subtracting a negative increases the result.

Use a split rectangle to explain the distributive law, connect the picture to arithmetic and reveal common mistakes without relying on a memorised slogan.

A run of heads does not make tails due on the next independent toss. Use a small classroom example to separate a sequence from the next event.

Square units measure area and cubic units measure volume. A small box example helps learners connect the notation to what is being counted.