
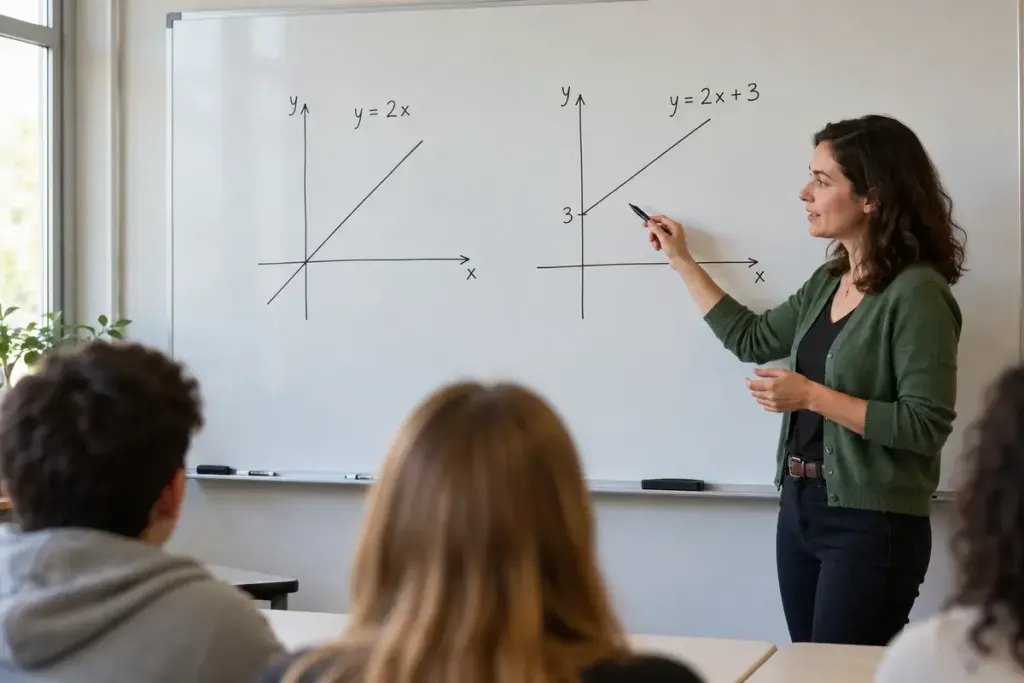
A straight line on a graph can show a constant rate of change without showing direct proportion. The difference becomes clear when you ask what happens at zero and whether the ratio between the two quantities stays constant.
For a directly proportional relationship between x and y, the form is y = kx, where k is constant. OpenStax’s discussion of variation places this within the wider family of relationships involving powers of x. Here we focus only on the simple proportional case.
Two imaginary printing shops
Shop A charges 2 units per page and has no setup fee. One page costs 2 units, two cost 4 and three cost 6. The ratio cost ÷ pages stays at 2, and zero pages corresponds to zero cost in this model. Its equation is y = 2x.
Shop B charges the same 2 units per page plus a 5-unit setup fee for an order. The model is y = 2x + 5. One page costs 7 units, two cost 9 and three cost 11. The increase per page is constant, but the ratios are 7, 4.5 and approximately 3.67.
Both graphs are straight lines. Only the first represents direct proportion between pages and total cost. The second line has a non-zero intercept because of the fixed charge.
The examples use invented prices and simplified rules. In a real shop, zero pages may mean no order at all, discounts may apply and only whole-number page counts may be possible. A mathematical model should state the situation it represents.
A useful three-part check
- Read the axes and units before looking at the line.
- Compare y ÷ x for several non-zero x values.
- Check whether the model passes through the origin.
Do not divide by zero when checking the ratio. Also remember that a curve can pass through the origin without being proportional; y = x² is a simple example.
For practice, invent a service with a fixed fee and a per-item charge. Explain in words why doubling the item count does not double the total bill. That explanation is often a stronger sign of understanding than drawing the line neatly.